
Global LNG trade is flat for the first time in over a decade. At the same time, Shell just forecast a 65% jump in demand by 2050. Both numbers come from the same report, and both are true. So what should you actually take from this, whether you’re watching your portfolio, buying gas for a business, or planning around US energy policy?
Shell released its 10th annual LNG Outlook on June 30, 2026, and it tells two very different stories depending on the timeline you look at. Short term, the market is stuck in place because of a supply shock in the Middle East. Long term, Shell still sees a market that grows by roughly two-thirds over the next 25 years. This article breaks down what Shell’s report actually says, why 2026 looks weak, and what it means specifically for US investors, energy buyers, and business strategists watching this sector.
What Does Shell’s LNG Outlook 2026 Actually Say?
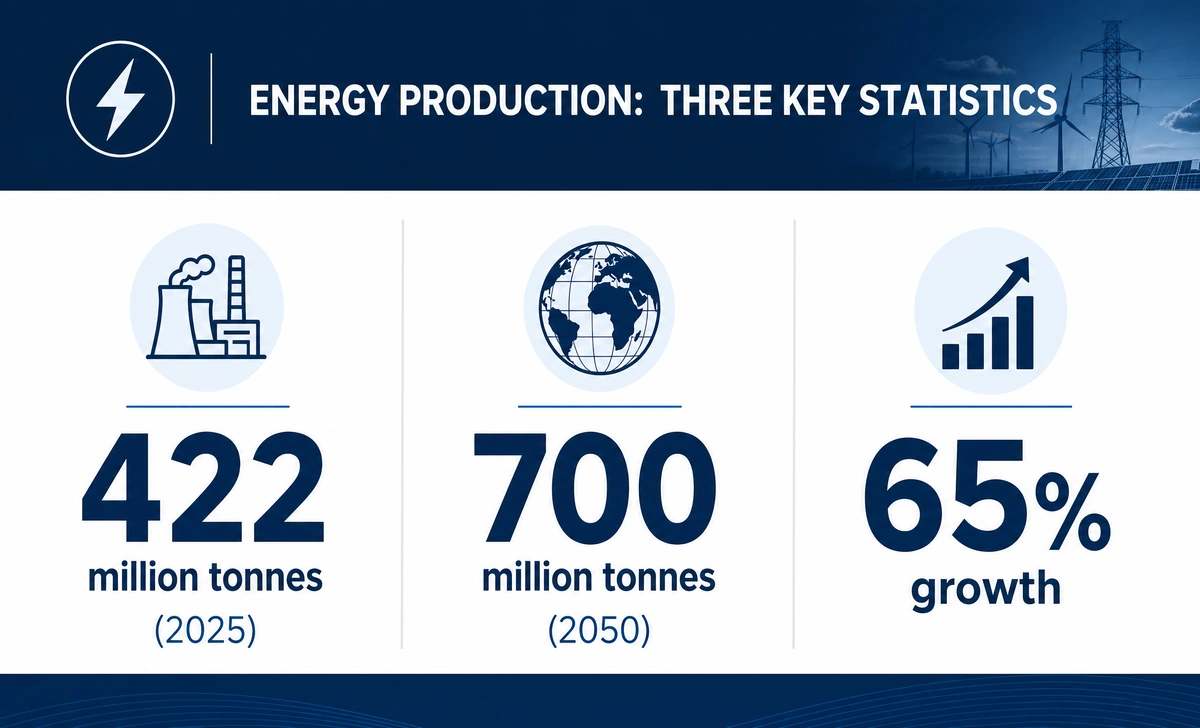
Global LNG trade reached 422 million tonnes in 2025. For 2026, Shell expects trade to be flat, and possibly negative, which would mark the first annual contraction in more than ten years. That’s the near-term headline.
The longer view is where the story shifts. Shell projects the market will reach roughly 700 million tonnes a year by 2050, a 65% increase from 2025 levels. Cederic Cremers, President of Integrated Gas at Shell, described the industry as having proved resilient and able to adapt through the recent disruption.
Put simply: 2026 is a pause, not a reversal. The question is how long that pause lasts, and what fills the gap once it ends.
Why Is 2026 LNG Trade Flat — Or Worse — For the First Time in a Decade?
The main driver is the Strait of Hormuz crisis, which has shut in an estimated one-fifth of the world’s monthly LNG supply. That’s a meaningful chunk of global capacity offline at once, and it’s the reason Shell’s 2026 numbers look so different from prior years.
If the Strait stays closed for several more weeks, Shell’s report points to a real possibility of an annual contraction in LNG supply, something the market hasn’t seen in over a decade. If shipping through the region normalises by summer, trade should end up roughly in line with 2025 levels instead. Even a resolution doesn’t mean an instant fix, since facilities coming back online typically need six to eight weeks to ramp back up to full output.
The price effect has already shown up. Asian spot prices climbed above $20 per million British thermal units (MMBtu) at the peak of the disruption. That’s a sharp move, though still below the extremes hit during the 2022 energy crisis, which suggests the market has more shock absorption than it did four years ago.
Key factors behind flat 2026 LNG trade:
- The Strait of Hormuz disruption removing close to 20% of monthly global supply
- Damage to Qatar’s Ras Laffan export facilities following strikes tied to the conflict
- Price-sensitive buyers in Asia pulling back on purchases as spot prices spiked
- Rising North American production partly offsetting the losses elsewhere
What Does the Strait of Hormuz Crisis Mean for Global LNG Supply?
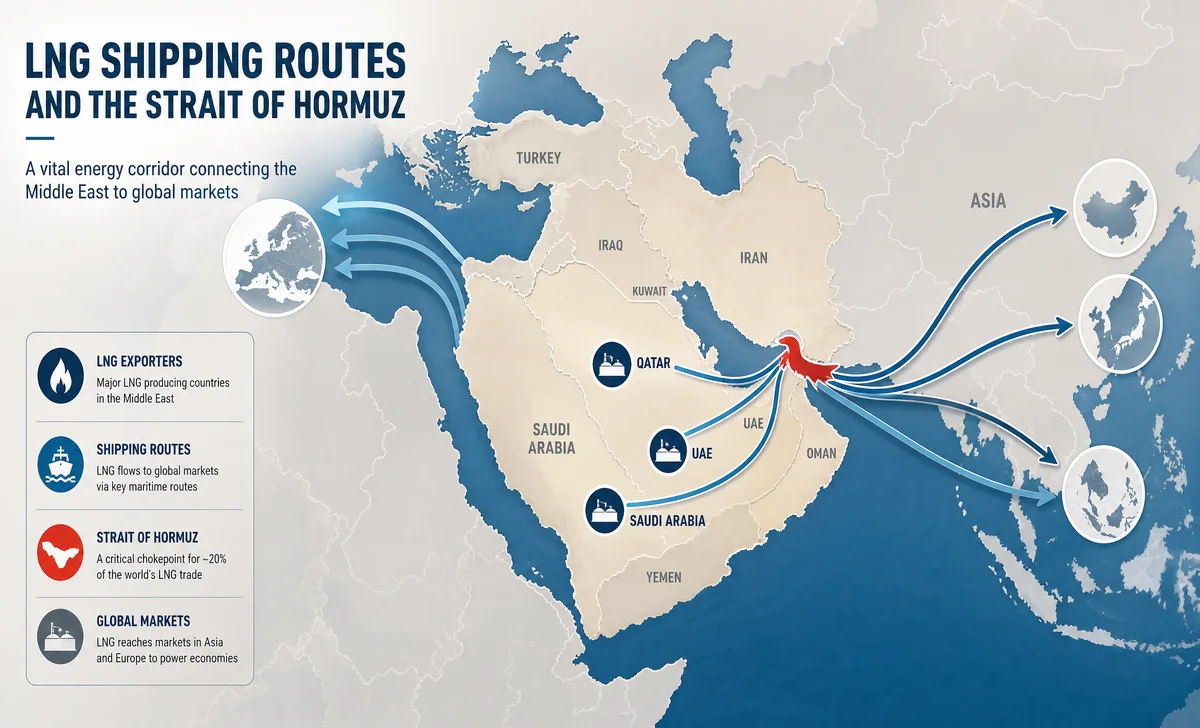
The Strait of Hormuz is one of the most important chokepoints in global energy trade, and the current conflict, which began in late February 2026, has put a large share of the world’s LNG supply at risk. Shell holds an equity stake in Qatar’s Ras Laffan complex, one of the facilities affected by the disruption, which gives the company direct exposure to how this plays out.
Shell’s report lays out two paths forward. In the base case, the Strait reopens by summer 2026, trade stays roughly flat for the year, and growth resumes in 2027. In the alternative scenario, a prolonged closure pushes the market into an outright annual contraction, something that hasn’t happened in the LNG trade in more than a decade.
Looking further out, Shell’s modelling shows global supply falling behind demand around 2037, with an estimated shortfall of 100 to 300 million tonnes per annum (MTPA) by 2050, depending on how much new capacity actually gets built between now and then.
| Aspect | 2026 (Short-Term) | 2050 (Long-Term) |
|---|---|---|
| LNG trade growth | Flat or negative | Up 65% from 2025 |
| Key driver | Strait of Hormuz disruption | Asian demand, data centres, shipping |
| Supply outlook | Constrained, possible contraction | About 180 MTPA of new supply by 2030, more needed after |
| Price pressure | Spot prices above $20/MMBtu at the peak | Structural shortfall pushing prices higher over time |
| US role | Swing supplier, offsetting losses elsewhere | Close to 60% of new liquefaction projects |
Where Will LNG Demand Grow — and Why Does Asia Matter So Much?
Asia carries most of the weight in Shell’s long-term forecast. South and Southeast Asia are expected to account for around 40% of global LNG imports by 2050, driven by population growth, industrial expansion, and a continued shift away from coal toward gas in power generation.
There are also newer demand sources worth watching. Data centres, particularly in Japan and other developed Asian markets, are pushing electricity demand higher, and gas is playing a growing role in meeting that load. LNG bunkering, which means using LNG as marine fuel for ships, is projected to grow sevenfold to 27 million tonnes by 2035.
China is a bit of a wild card in the near term. Import volumes may soften while geopolitical uncertainty persists, but Shell still expects underlying natural gas demand in the country to keep climbing over the long run.
To keep pace with all of this, Shell estimates the market needs about 180 MTPA of new supply by 2030, with another 200 MTPA required beyond currently sanctioned projects to avoid a shortfall later on.
What Role Does the US Play in Shell’s LNG Outlook 2026?
This is where the US becomes central to the whole story rather than a side note. The US accounts for close to 60% of continuing LNG liquefaction projects worldwide, well ahead of Qatar’s roughly 15% share. That’s not a minor gap. It puts American export capacity at the core of how the market fills the supply hole left by the Middle East disruption and, later, the 2037 shortfall Shell’s models point to.
North American production increases have already partly offset the losses tied to Hormuz, acting as one of the more flexible tools the market has during this stretch. Shell’s report is direct about what it takes to keep that going: reliable infrastructure and consistent policy. For the US, that translates into steady regulatory support for LNG exports, not just current output.
If you’re tracking this from an investing or business planning angle, the things worth watching are Final Investment Decisions (FIDs) on new Gulf Coast projects, the regulatory environment around permitting and exports, and how close existing terminals run to full capacity. As Asian demand climbs over the next decade, US exports are one of the main ways that gap gets filled, but only if the policy and infrastructure side keeps up with the projects on paper.
Hitting a 60% share of new global liquefaction capacity is not just a matter of announcing new terminals. It takes the operating base to support years of continuous buildout, from permitting teams to logistics and workforce planning that can handle several projects running at once across the Gulf Coast. Companies that get this right tend to follow the same underlying model that applies to any business scaling quickly, one built around the groundwork described in this breakdown of operational infrastructure for business scaling.
What’s the Bottom Line for US Investors and Energy Buyers?
For investors: Treat 2026 as a volatile stretch, not a collapse. Flat trade doesn’t mean falling prices. Spot prices are elevated, and roughly two-thirds of global LNG trade still runs on long-term contracts, which cushions the market against short-term swings. Growth should pick back up from 2027 onward as new supply comes online, and the 100 to 300 MTPA shortfall Shell projects for 2050 points to a strong long-term case for the sector.
For energy buyers: Long-term supply contracts are worth locking in where you can, since they’re the main source of price stability right now. Keep an eye on US export capacity specifically, since it’s your best hedge against another Middle East disruption. Spreading purchases across multiple supply sources also reduces your exposure to any single chokepoint.
For business strategists: The link between data centres and LNG demand is real and growing, and it’s worth factoring into longer-range energy planning. LNG bunkering is a smaller but fast-growing segment, with sevenfold growth projected by 2035.
Energy companies weighing new US projects are also dealing with a shifting federal tax picture, not just export policy. Firms that claimed pandemic-era relief in prior years are now finding older filings under closer review, and the rules have changed enough that a claim considered solid a few years ago may not hold up today. Anyone with legacy claims on the books should look closely at how ERC disallowances under OBBA could affect current tax exposure before folding new capital projects into the same balance sheet.
None of this works as a one-time check. Reading a single report and moving on tends to miss the smaller signals that build up over months, whether that’s a shift in Asian import volumes or a new FID announcement. Investors who review these indicators on a set schedule, refine what they’re watching each time, and adjust based on what actually moved the market tend to catch turns earlier than those who check in occasionally. That kind of structured, repeated review is the same principle behind the Innøve learning method, applied here to market tracking instead of skill building.
Five takeaways for US investors and energy professionals:
- Don’t read too much into flat 2026 trade. It’s geopolitical, not structural.
- Track US LNG export capacity closely. It’s the clearest signal of where this market is heading.
- Lock in long-term supply contracts for price stability while spot prices stay elevated.
- Watch Asian import data. It drives the long-term demand thesis more than anything else.
- Position now for the supply gap Shell expects around 2037. The projects that get financed and approved in the next few years will be the ones positioned to benefit.
The Bottom Line
Shell’s LNG Outlook 2026 tells a story of two timelines. The near term is messy, shaped by the Strait of Hormuz disruption and the first flat or negative year for LNG trade in over a decade. The long term still points to a market that grows by 65% by 2050, with the US supplying close to 60% of the new capacity needed to get there.
For US investors and energy professionals, the smart move is to look past the 2026 noise and focus on the structural shortfall Shell expects later this decade and into the 2030s. The projects and companies that secure financing and FIDs now are the ones likely to come out ahead once the market tightens again. Keep watching Strait of Hormuz developments and new US export project announcements. Both will tell you a lot about how this plays out.




No Comment! Be the first one.